Position Sizing for Day Trading: The Formula That Caps Every Loss
The share count is an output, not a guess: risk budget divided by stop distance, rounded down, bracketed at entry. The one-division formula, the survival math behind the 1% rule, and the Thursday-morning tale of $60 lost versus $325 lost on the identical setup.
By Troy Swartwood, Founder & Software Engineer · Published 2026-10-02
Ask a struggling trader how many shares they bought and you'll hear a round number: 100, 500, a thousand. Ask why and you'll hear some version of "felt right." Position sizing for day trading replaces that feeling with arithmetic: the share count is an output, calculated from how much you're willing to lose and where the stop sits, never an input you pick because it sounds like a real position. Two traders can take the identical setup and get opposite outcomes on their accounts purely from sizing, which makes this the highest-leverage math in trading. It's also the easiest, since the whole thing's one division problem.
What is position sizing for day trading?
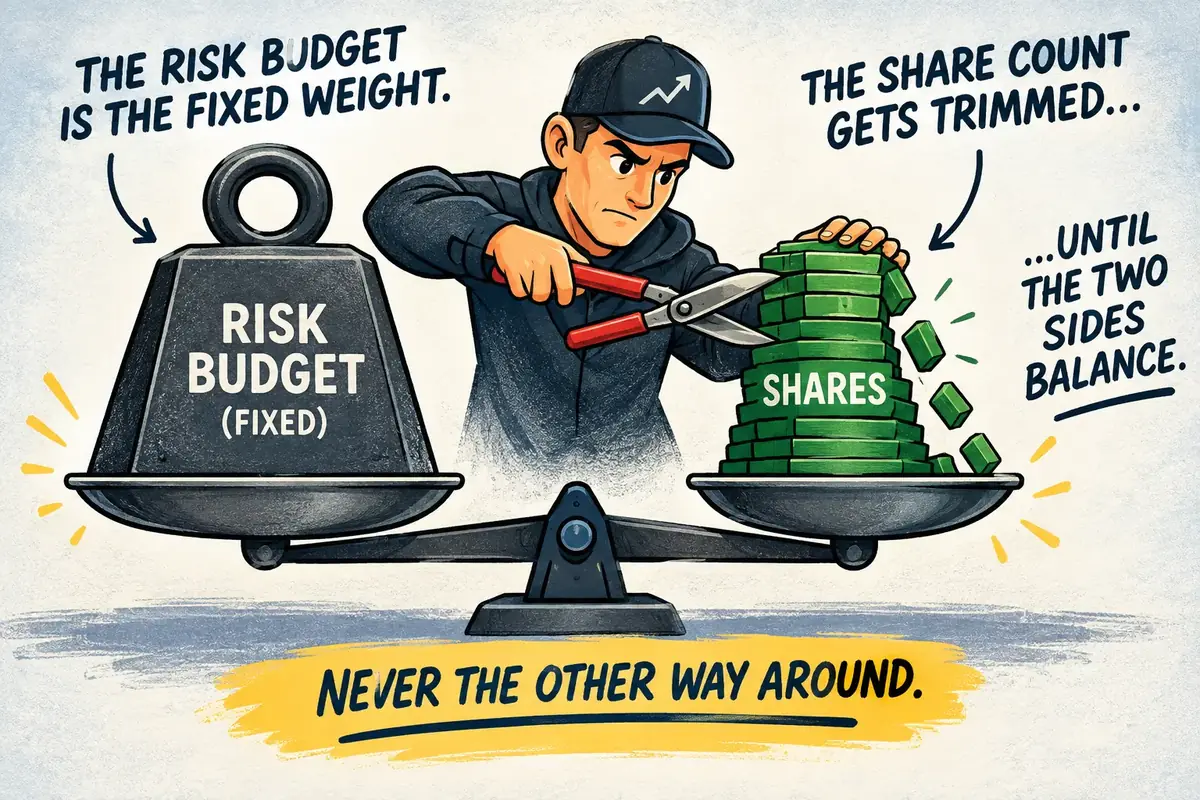
Position sizing is the process of calculating how many shares to trade based on a fixed risk budget and the distance to your stop loss, so every losing trade costs a predictable, bounded amount. The sequence runs in one direction: decide the dollars you'll risk on the trade (usually a small percentage of the account), find the stop at the level that proves the setup wrong, measure the distance from entry to stop, and divide. The share count falls out at the end. Run it backward, picking a share count and then finding a stop that "fits," and the stop ends up placed by your position instead of the chart, which is how risk controls quietly become decoration.
Why round numbers lose
A fixed habit like "I always trade 500 shares" means your actual risk swings wildly with every setup, because stop distances differ trade to trade. Five hundred shares with a 10-cent stop risks $50; the same 500 with a 60-cent stop risks $300, a sixfold difference the trader never consciously chose. Sizing from risk inverts that: the dollar loss stays constant and the share count does the adjusting.
How does the formula work?
Shares = risk budget ÷ stop distance. That's the entire formula. Take a $6,000 account risking 1 percent, which sets the budget at $60. A setup triggers at $12.40 with the structural stop at $12.10, so the distance is 30 cents, and $60 divided by $0.30 is 200 shares, a $2,480 position where the worst planned outcome is the $60 you already accepted. The same budget resizes itself automatically as stops change: tighter stops allow more shares, wider stops force fewer, and the loss stays pinned either way. The free position size calculator runs this in one pass and adds the R-multiple targets, but honestly, the napkin version takes ten seconds.
| Stop distance | Shares ($60 risk) | Position value at $12.40 | Planned worst case |
|---|---|---|---|
| $0.15 | 400 | $4,960 | $60 |
| $0.30 | 200 | $2,480 | $60 |
| $0.60 | 100 | $1,240 | $60 |
| $1.20 | 50 | $620 | $60 |
Notice the second column halving as the first doubles. That inverse relationship is the whole machine, and it only works if the stop's real, meaning placed at the setup's invalidation level and attached at entry. Both halves of that discipline are covered in the stop loss framework and bracket orders explained.
What's the right percent to risk per trade?
Between 0.5 and 2 percent of the account, with 1 percent as the standard starting point for position sizing for day trading, better known as the "1% rule." The number exists to survive sequences, because losing streaks aren't a possibility, they're a statistical certainty, and the risk percent decides what a streak costs. At 1 percent, five straight losses dent the account about 4.9 percent, an ordinary week that three or four winners repair. At 5 percent per trade, the same streak craters nearly a quarter of the account, and the recovery math starts working against you the way the daily loss limit guide lays out. Don't pick the percent for the trade. Pick it for the streak.
| Risk per trade | 5 straight losses | 10 straight losses |
|---|---|---|
| 0.5% | -2.5% | -4.9% |
| 1% | -4.9% | -9.6% |
| 2% | -9.6% | -18.3% |
| 5% | -22.6% | -40.1% |
Beginners should start at the bottom of the band, 0.5 percent or less, while the win rate's still an unknown (tuition's cheaper in small denominations). The general relationship between risk taken and outcomes dispersed is covered plainly in the SEC's investor guidance on understanding risk.
Where does sizing go wrong?
Four ways, and conviction's the first. "This one's different" talks traders into doubling the size on their most emotionally loaded setups, which concentrates the biggest risk on the decisions made with the least objectivity. Averaging down is the second, since adding to a loser manufactures a bigger position with a worse basis and usually no stop at all. Rounding up is the quiet third: the formula says 163 shares, the order ticket says 200, and the extra 23 percent of risk was never decided, just typed. Thin stocks supply the fourth, because slippage on fast, low float names means the fill lands past the stop and the real loss overshoots the plan, which is why the low float guide treats a size haircut as mandatory equipment there.
Round down. Always.
What one "felt right" costs
Picture a Thursday in mid-September, 9:42 a.m. The formula trader takes the $12.40 entry at 200 shares, the stop at $12.10 fires on a failed breakout, and the loss prints $60 plus a few dollars of slippage. At the next desk, same setup, a trader who "really liked this one" bought 500 shares, skipped the bracket, and started negotiating when it broke. He's out at $11.75 for a $325 loss, five and a half budgets gone on one trade, and (here's the part the P&L doesn't show) he now needs to win back more than 5 percent of a $6,000 account while trading angry. The formula trader's morning continued. His didn't, really.
Before the next entry, check four things
- Risk budget set as a percent, in writing, inside the playbook.
- Stop at the invalidation level first.
- Shares from the division, rounded down, never up.
- Bracket attached at entry.
Enforcement closes the loop. XeanVI computes the share count from your configured risk limit and the setup's stop on every trade it routes, attaches the bracket at entry on your own Alpaca account, and bounds the whole thing under hard loss caps with each decision logged, so the sizing math runs identically on trade one and on the tilted hypothetical trade that never gets to exist. It starts in free paper mode, where the formula can prove itself before a real dollar's involved.
The size is the risk decision; everything after entry is just watching it resolve.
Key takeaways
Position sizing for day trading, condensed: budget a small fixed percent, let the stop distance set the share count, round down, bracket at entry, and cut the size further on thin names where slippage taxes the fill. There's no formula that prevents losing trades, and none of this is financial advice; trading involves real risk of loss, and paper trading's the place to test any sizing rule. What the division promises is narrower and worth more: your losers cost what you planned, which over a few hundred trades turns out to be the entire game.