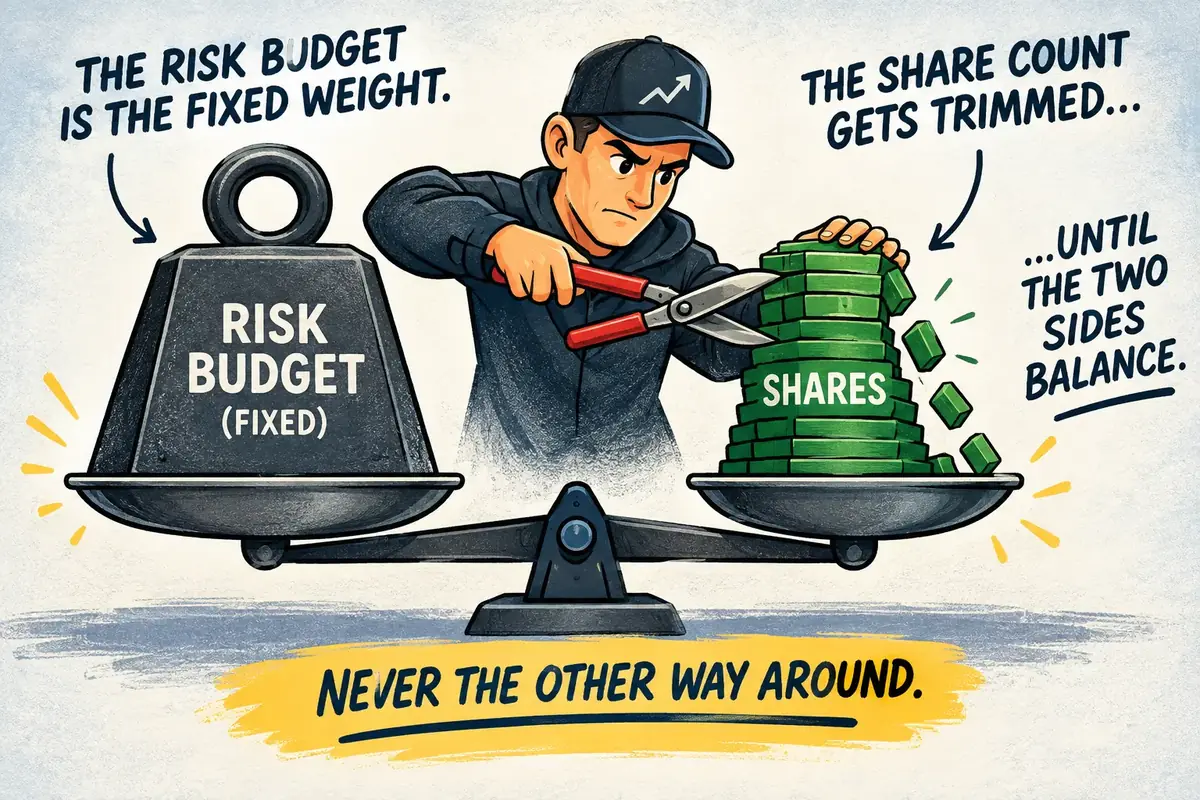
The share count is an output, not a guess: risk budget divided by stop distance, rounded down, bracketed at entry. The one-division formula, the survival math behind the 1% rule, and the Thursday-morning tale of $60 lost versus $325 lost on the identical setup.
Nobody blows up $75 at a time. Accounts die in single tilted sessions, which is what a daily loss limit exists to interrupt. How to size it at two to three losses, the recovery math that sets the ceiling, and the $460 Tuesday that shows why the enforcement can't be you.
Most traders place stops at the dollar amount that hurts. The working method runs backward: stop at the level that proves the setup wrong, size from that distance, attach it at entry as a bracket, and budget for the slippage that thin stocks charge. With the $76.80 lesson on why.
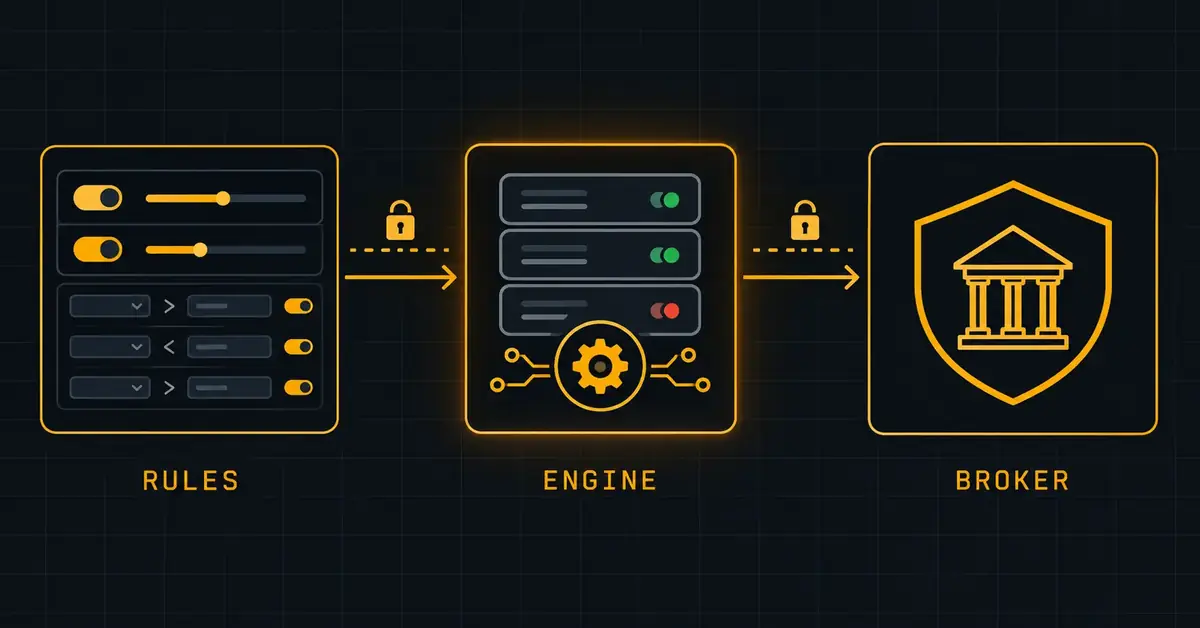
No-code removes the programming problem and leaves every trading problem exactly where it was. Here's how hosted rule execution actually works, the DIY-vs-platform-vs-signals comparison, the custody check that disqualifies platforms instantly, and what one renegotiated stop costs in dollars.
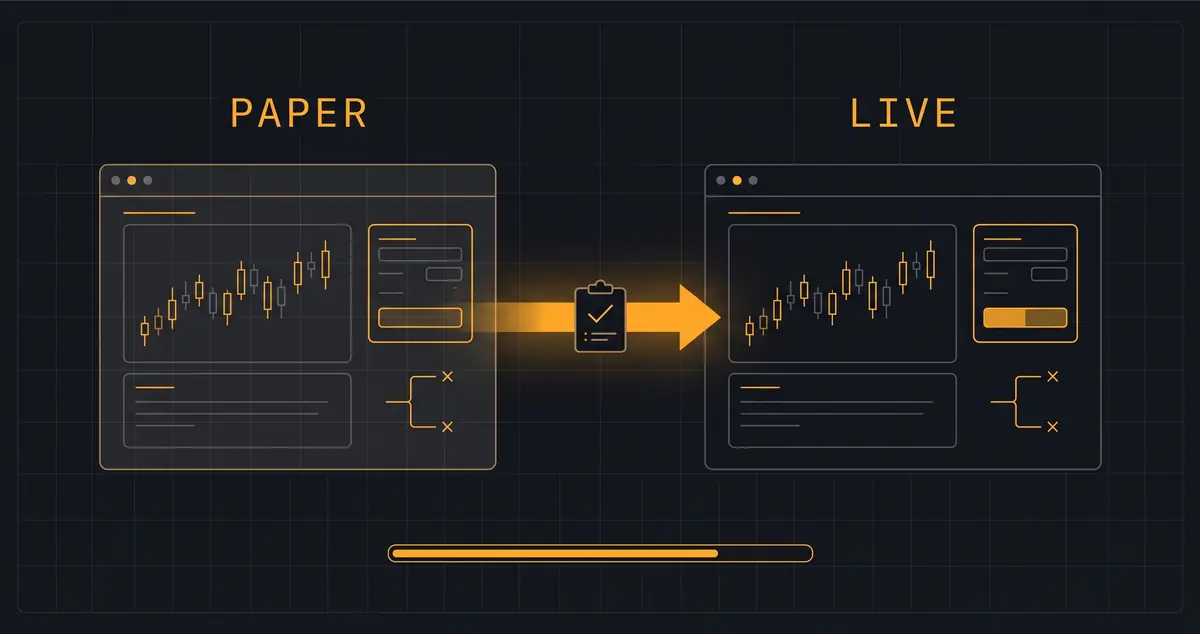
Alpaca's paper environment is a free mirror of a real brokerage — same orders, same API, live data, simulated fills. Here's the setup that makes it useful, the slippage and psychology it can't fake, and the 30-to-50-trade graduation bar before real money gets involved.
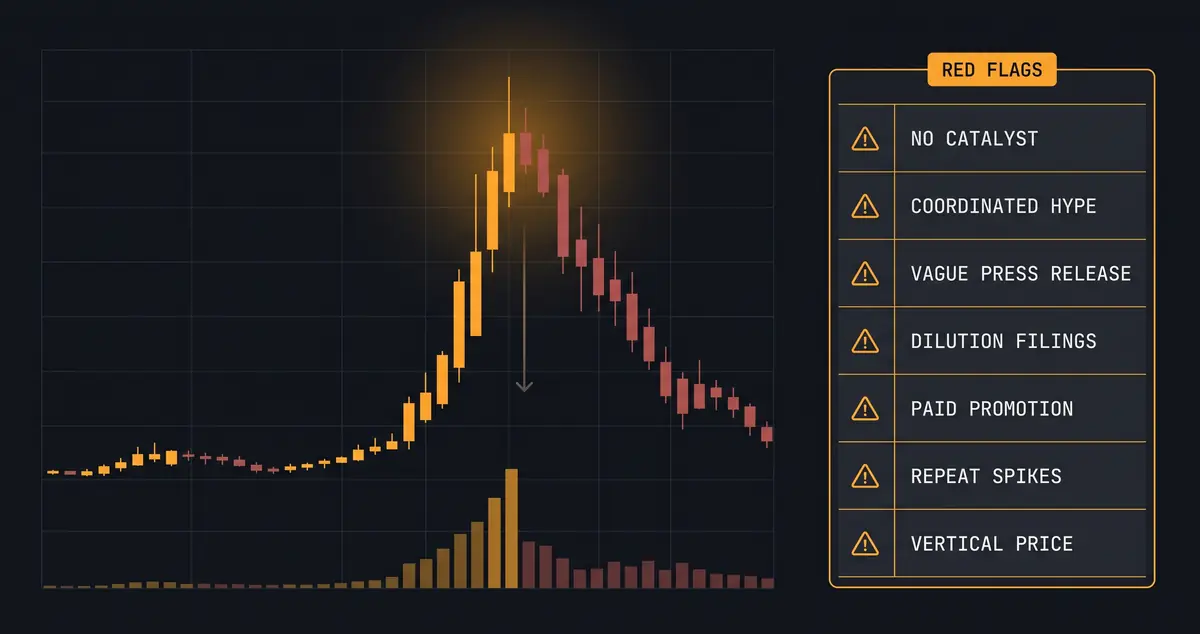
Pump and dumps target exactly the stocks momentum scanners surface: low float, cheap, suddenly loud. Here are the seven red flags, the five-minute verification routine that separates real catalysts from manufactured ones, and the late-stage tell that outranks all the others.
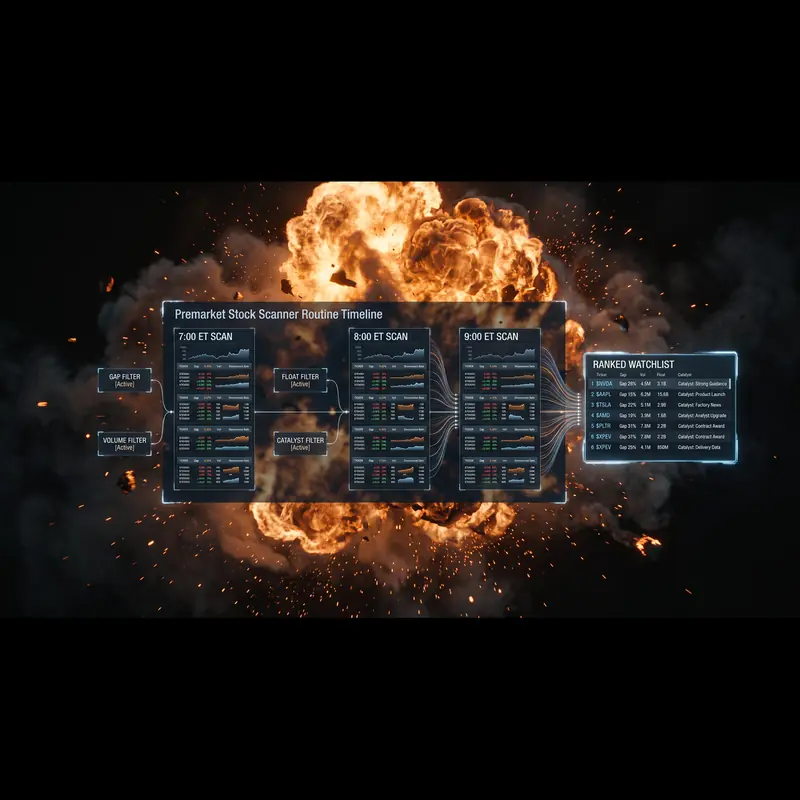
The day's best setups are usually decided before 9:30. Here's the premarket scanning routine that finds them: five filters with exact thresholds, the 7:00–8:00–9:00 scan rhythm, and why most gaps that look tradable at 8:15 shouldn't be touched until the open.
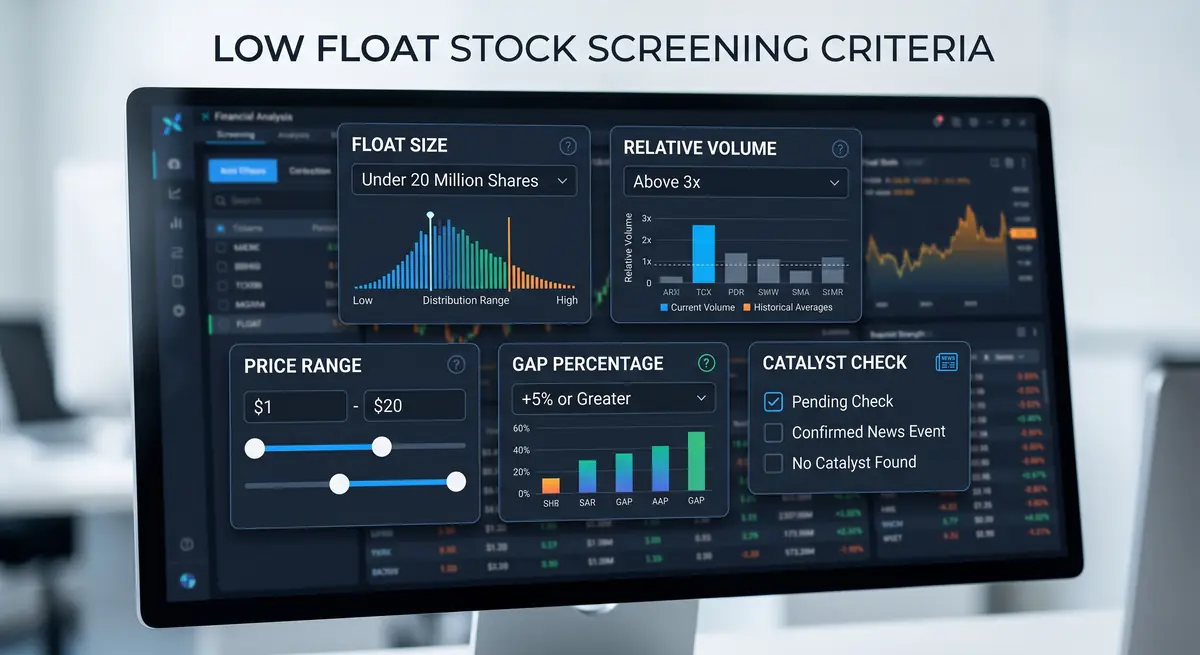
Low float is the common ingredient in the market's biggest single-day moves. Here's the exact screen that finds these stocks before they run, why screener float data lies to you, and the dilution check that keeps you out of the traps.
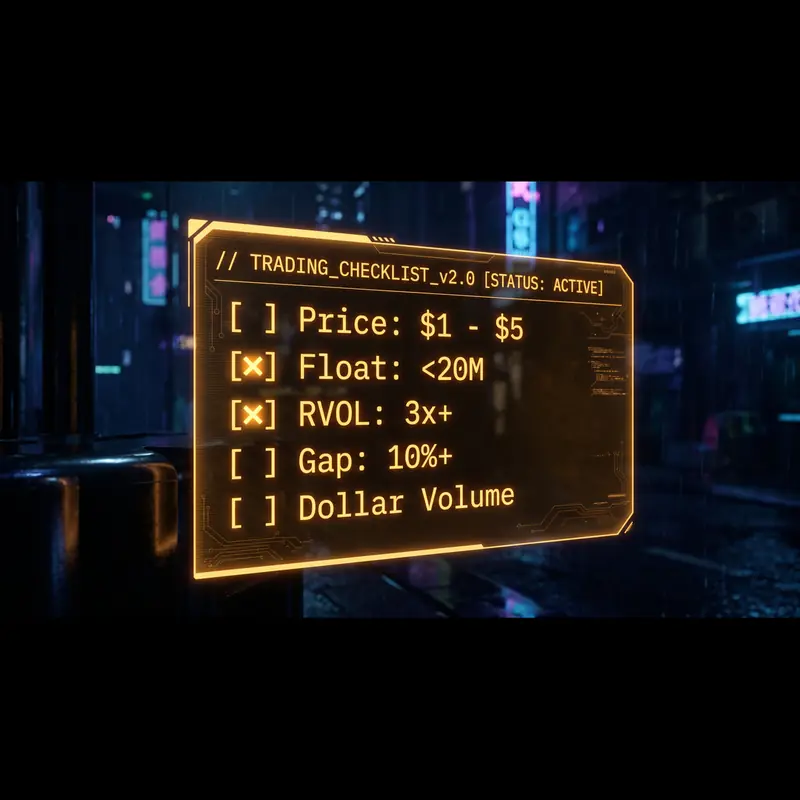
Most "best penny stock scanner" guides rank tools. This one shows you the filter logic that actually finds runners: the $1–$5 price band, sub-20M float, 3x+ relative volume, 10%+ gaps, and real dollar liquidity — plus when to scan during the session and how to separate a genuine setup from someone's exit pump.
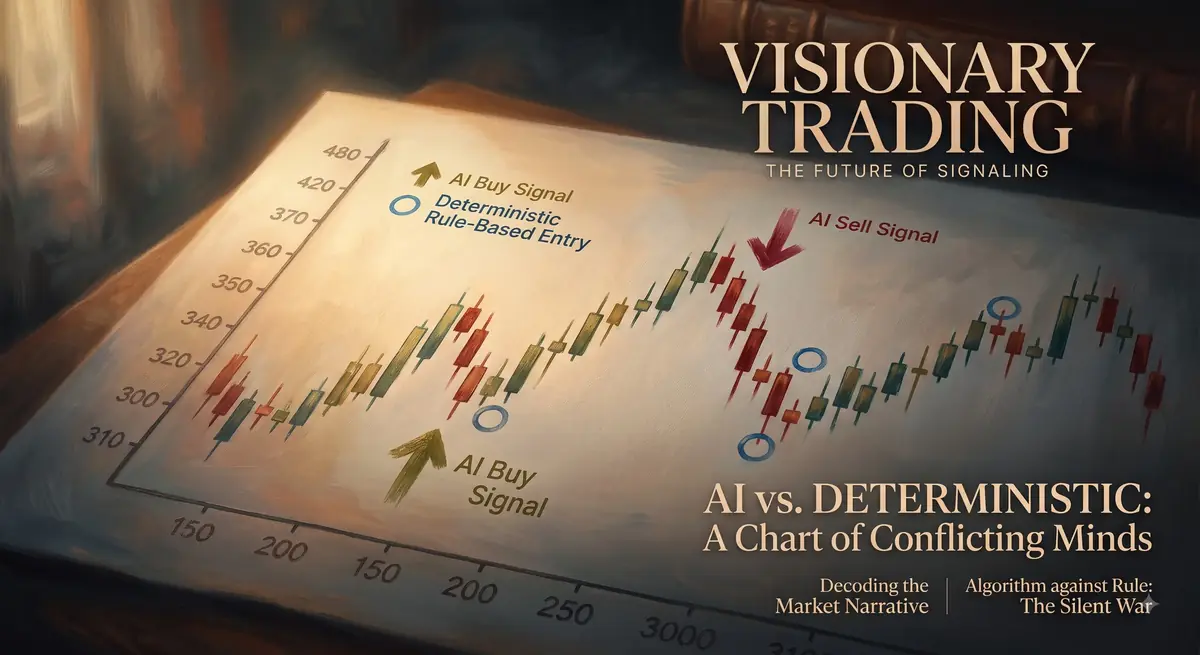
While machine learning models can generate buy and sell signals, no retail vendor backs those claims with independently verified live performance. This guide breaks down how predictive algorithms are built, where they structurally fail, and why XeanVI protects capital through deterministic execution instead.