How to Find Low Float Stocks Before They Run
Low float is the common ingredient in the market's biggest single-day moves. Here's the exact screen that finds these stocks before they run, why screener float data lies to you, and the dilution check that keeps you out of the traps.
By XeanVI Team · Published 2026-09-02
Most of the market's biggest single-day percentage moves share one ingredient: a small float. Traders who learn how to find low float stocks before they run are not predicting anything; they are screening for a measurable supply-and-demand imbalance and getting there early in the move. The mechanics are unforgiving in both directions, which is why this guide spends as much time on the traps, the stale data, and the risk math as it does on the screen itself.
What is a low float stock?
A low float stock is one with a small number of shares actually available for public trading, generally under 20 million. Float equals shares outstanding minus insider holdings, restricted stock, and other locked-up blocks, so it measures tradable supply rather than company size. When sudden demand hits that thin supply, price moves violently because there are not enough willing sellers to absorb the buying; the same dynamic runs in reverse on the way down. There is no official regulatory definition of "low float." The thresholds are working conventions momentum traders use to separate stocks capable of outsized percentage moves from ordinary small caps, and the lower the float, the bigger the potential move and the worse the tradability at the same time.
The bands matter because behavior changes sharply as float shrinks:
| Float band | Shares available | Typical behavior | Spread & fill risk | Halt risk |
|---|---|---|---|---|
| Low float | 10M – 20M | Sustained multi-hour runs on volume; tradable pullbacks | Moderate | Occasional |
| Very low float | 3M – 10M | Violent moves both directions; 50%+ days possible | Elevated; exits slip | Common on catalysts |
| Micro float | Under 3M | Capable of 100%+ days and equally fast full retraces | Severe; spreads of several percent | Frequent, multiple per session |
For most intraday traders the workable zone is 3 to 20 million shares, not the smallest number the scan can find. Below 3 million, the spread and halt mechanics start taking back most of what the volatility gives. A fuller primer on the supply side sits in what is float in day trading.
How do you find low float stocks before they run?
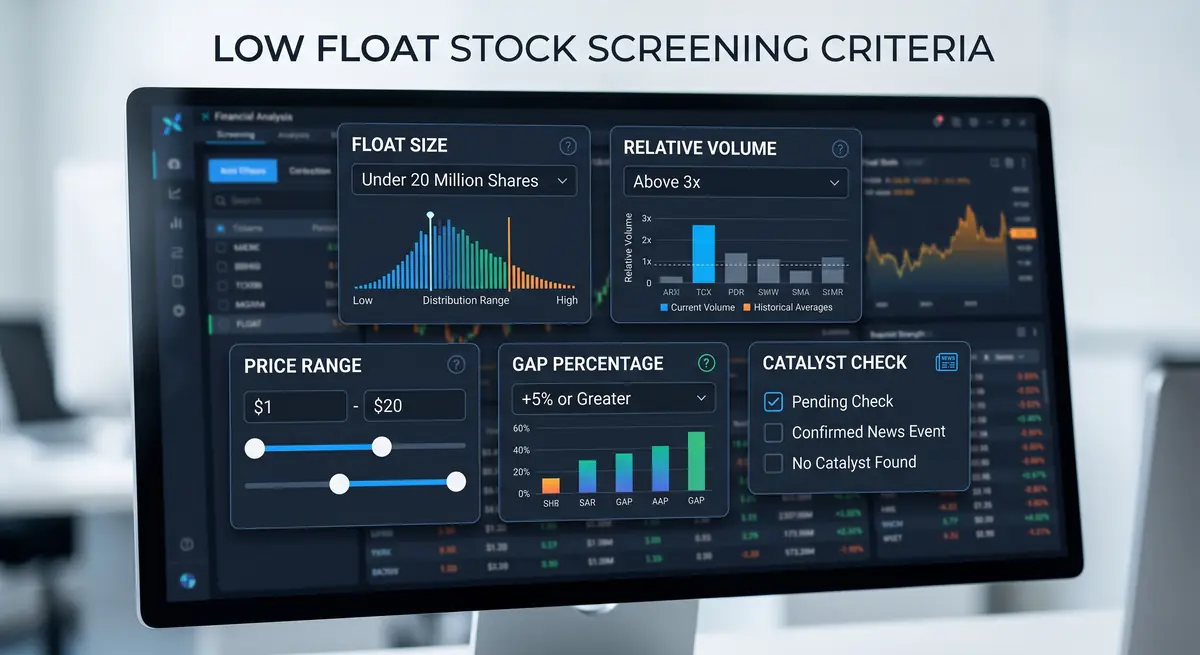
Combine one supply filter with three demand filters and a catalyst check. The screen: float under 20 million shares, price between roughly $1 and $10, relative volume above 3x to 5x the ticker's own average, a gap or intraday move of at least 10 percent already underway, and a findable reason for the move such as a filing, contract, or FDA date. Run it premarket to build the day's watchlist, then again during the first hour for fresh breakouts. On a typical session this returns two to six names, which is the point: fewer, stricter filters produce a shortlist a human can actually evaluate, while loose filters produce a wall of tickers that all look the same.
Why each filter earns its place
Float alone finds nothing. Thousands of forgotten shells have tiny floats and no volume; without demand evidence, a low float is just an illiquid stock nobody wants. Relative volume is the attention gauge, and attention is what sustains a move past its first spike. The 10 percent threshold keeps you reactive instead of predictive: the job is catching today's mover early, not guessing which sleeper wakes up someday. Price banding matters because retail order flow can actually move a $3 stock, while the same dollars vanish into a $40 name. And the catalyst check is the honesty filter, since movement with no findable reason is usually promotion, and promoted moves end the way promotions always end. The sub-$5 slice of this screen has its own additional rules, covered in the penny stock scanner setup guide.
The rotation effect
The same low-float names run repeatedly. A ticker that squeezed in March reappears in June on fresh news because the float never changed and trader attention returns faster the second time. Keep a log of every name your screen surfaces, with its float and how it behaved. Within two months you will recognize half of each day's scan on sight, and knowing how a specific ticker trades is an edge that costs nothing but note-taking. Candidate selection from that shortlist is its own skill: which penny stocks should you actually trade?
Why is screener float data often wrong?
Float is a reported estimate assembled from filings, not a live market feed, and it goes stale in ways that matter most on exactly the stocks this screen surfaces. Companies that spike tend to sell shares into the spike, and an offering can double the float overnight while your screener keeps displaying last month's figure for days. Data vendors also disagree with each other; seeing 4 million on one platform and 9 million on another for the same ticker is routine, because each estimates locked-up shares differently. The practical rule: treat screener float as a first-pass filter only, and verify the number against the company's most recent filings before trading any name where the float is central to your thesis.
The three staleness traps
Offerings are the big one. A shelf registration or an active at-the-market facility means the company can create new supply at will, and dilution is the single most common way low-float longs get wrecked. Vendor disagreement is second; when the float number drives the trade, two minutes on the latest 10-Q or prospectus beats trusting any single screener field. Third is the conflation of float with short interest. They are related inputs to the squeeze profile but come from separate sources on separate reporting lags, and a "low float squeeze" thesis built on stale short data fails just as hard as one built on stale float. The company-side version of this trap, where every spike gets sold into by the issuer itself, is documented in the reality of penny stock trading.
How do you trade low float stocks without blowing up?
Decide the exit and the size before the entry, and let software enforce both. A stock that can move 10 percent in a minute converts improvisation directly into losses: size the position off the dollars you are willing to lose, place the stop at the level that invalidates the setup, and attach that stop at entry as part of the order rather than as an intention. Check dilution history and the live spread before any fill, and assume a halt can reopen far from where it stopped. None of this reduces the volatility; it bounds what the volatility can cost you, which is the only variable actually under your control.
Pre-trade checks
Three items, in order. Filing history first: repeated offerings or a toxic convertible means the issuer sells every spike, including yours. Spread second: a 3 percent bid-ask means you are down 3 percent at the fill, and thin books mean the exit you imagine may not exist at the price you imagine it. Halt exposure third: volatility pauses are routine in this category, so size for the gap-through scenario rather than the smooth chart.
Sizing, stops, and the case for enforcement
The arithmetic is mechanical. Account size times risk percent gives dollar risk; dollar risk divided by the entry-to-stop distance gives the share count, and the free position size calculator does it in one pass with R-multiple targets included. Bracket orders make the stop structural instead of psychological. Enforcement is where automation earns its keep on this category specifically: XeanVI runs the loop as one pipeline, with scheduled scans surfacing low-float movers, gate-by-gate validation against playbook rules including catalyst checks, and qualifying setups routed to your own Alpaca account as bracket orders carrying a hard loss cap, every decision logged including the skips. The scan-to-capped-order path takes seconds, which matters most on the stocks that move fastest, and it runs in free paper mode first, which is the right place to learn how violent this category is.
| Approach | Data speed | Float filtering | Execution & risk enforcement | Fits |
|---|---|---|---|---|
| Free screeners (e.g. Finviz) | Delayed ~15 min | Basic, often stale | None; manual everything | Study and end-of-day review |
| Paid real-time scanners | Real-time | Strong (float, RVOL presets) | Alerts only; discipline is on you | Manual traders with a tested process |
| XeanVI pipeline | Real-time, scheduled scans | Float + RVOL + catalyst gates | Bracket orders with hard loss caps, auto-routed, fully logged | Rule-based traders wanting enforced risk |
Key takeaways
How to find low float stocks comes down to one screen run at the right times: float under 20 million, price $1 to $10, relative volume above 3x, a move of 10 percent already underway, and a catalyst you can verify, executed premarket and again in the first hour. Verify float against filings because screener data lags exactly when it matters. Log every scan hit, since the same names rotate back. Check dilution history before the trade, not after. And treat sizing and stops as machinery rather than intentions, because in this category the difference between a capped loss and an account-denting one is decided before the entry, not during it.
XeanVI is software for rule-based trading workflows and does not provide investment, financial, legal, or tax advice. Low float stocks are volatile and illiquid; trading them involves substantial risk, including possible loss of capital, and most day traders lose money. Nothing here recommends a security, position size, or strategy for your account. Third-party tools are referenced from publicly available information; verify current data and features with each provider.