Best Penny Stock Scanner Setup: The Filters That Catch Runners
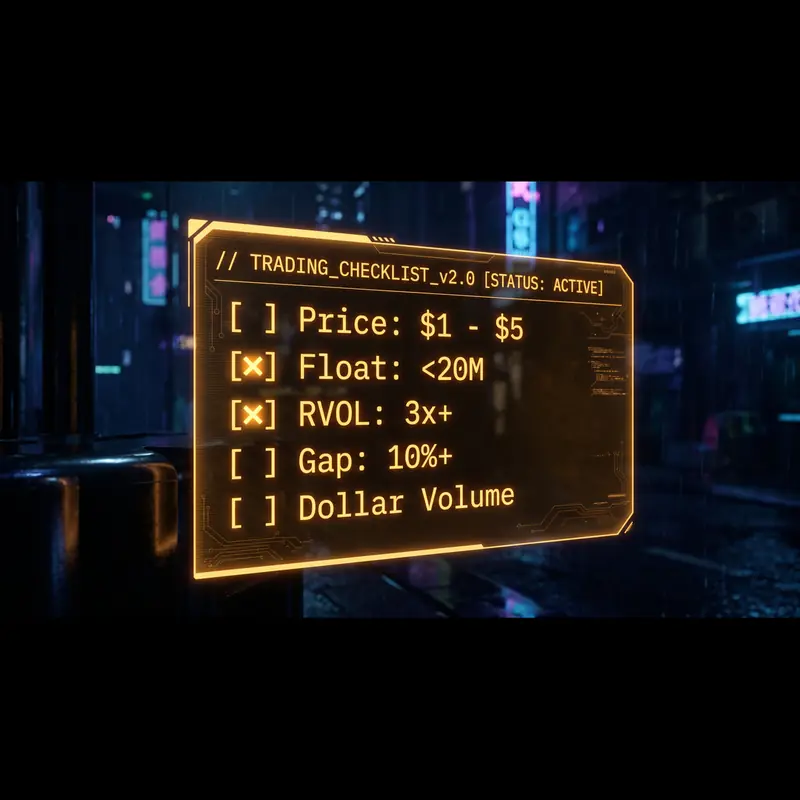
Most "best penny stock scanner" guides rank tools. This one shows you the filter logic that actually finds runners: the $1–$5 price band, sub-20M float, 3x+ relative volume, 10%+ gaps, and real dollar liquidity — plus when to scan during the session and how to separate a genuine setup from someone's exit pump.
By Troy Swartwood, Founder & Software Engineer · Published 2026-08-23 · Updated 2026-10-06
Search for the best penny stock scanner and you'll mostly find affiliate listicles ranking ten tools the writer has never traded with. This guide does something more useful: it shows you what a scanner actually needs to filter for to surface real runners, the exact thresholds day traders use, when to run scans during the session, and how to tell a genuine setup from bait. The tool matters less than the filter logic. Get the logic right and several platforms can do the job; get it wrong and the most expensive scanner on the market will feed you junk.
The short answer
- Five filters do the work: price band, float, relative volume, gap percentage, and real dollar liquidity.
- Speed matters: free scanners on 15-minute delayed data are fine for studying, too slow for live momentum.
- A scan is a candidate list, not a buy list. Catalyst, spread, and dilution checks come before any order.
- Sizing and stops are separate machinery. The scanner finds the trade; risk rules decide whether and how big.
What the best penny stock scanner actually filters for
Penny stocks move differently from large caps. Thousands of tickers under $5 do nothing all day; the handful that run share a measurable profile. These five filters isolate it.
- Price band. Most intraday penny traders work the $1 to $5 range. Below $1 the spreads widen as a percentage of price and listing-compliance risk grows; above $5 you're out of the category and into small caps. Set the band deliberately rather than scanning "everything cheap."
- Float under roughly 20 million shares. Float is the supply side of every squeeze. When demand hits a stock with a small tradable share count, the move is violent because there aren't enough shares to absorb it. This is the single most predictive filter for outsized percentage moves, and it's the one free screeners handle worst. Primer: what is float in day trading?
- Relative volume above 3x to 5x. Raw volume misleads on penny stocks. What matters is volume relative to the ticker's own normal: a stock trading five times its average has attention on it, and attention is what sustains a move past the first spike.
- Gap of 10 percent or more. Premarket gaps flag overnight catalysts. A double-digit gap on elevated premarket volume is the classic starting profile for a gap-and-go session. Gaps on no volume, by contrast, tend to fill fast.
- Real dollar liquidity. A million shares traded at $0.30 is $300,000 of actual money, thin enough that your own order moves the price. Filter on dollar volume, not share count, and check the spread before assuming you can exit near the quoted price.
Notice what's absent: RSI, MACD, analyst ratings. Indicator filters have their uses elsewhere, but penny momentum is a supply, demand, and attention game, and these five measure exactly those three things.
When to scan
Scanner output is only as good as its timing. The penny session has a rhythm:
- Premarket (7:00 to 9:30 ET): build the day's watchlist from gappers with volume. This is where the 10-percent-gap filter earns its keep.
- The open through ~10:30: the highest-energy window. Most clean gap-and-go and opening-range moves resolve here. Rescan for fresh high-of-day breaks.
- Midday: volume dries up and ranges tighten. Many disciplined traders simply don't take new penny entries here, and a scanner that keeps "finding" midday setups is mostly finding noise.
- The last hour: volume returns and afternoon breakouts happen, with the added constraint that anything entered late needs an exit plan before the close. Holding a penny position overnight is a different risk profile entirely.
One more timing point that separates studying from trading: delayed data. Free scanners typically run 15 minutes behind. For end-of-day review and pattern study, that's fine and genuinely worth doing. For live entries on stocks that can move 30 percent in ten minutes, it means you're seeing where the runner was.
Reading the results: candidate list, not buy list
Every name a scan surfaces gets three checks before it deserves an order.
Catalyst check. Why is it moving? A real catalyst (contract, FDA news, earnings surprise) supports continuation. No findable reason, or a vague promotional press release, is a warning, and one of several pump-and-dump warning signs worth checking before you buy. The distinction between a news-driven runner and a promoted pump is the difference between trading a move and being someone's exit liquidity. The dilution version of this trap, where a company sells shares into every spike, is covered in the reality of penny stock trading.
Spread check. If the bid-ask spread is several percent wide, your trade starts that far underwater. Wide spread plus low dollar volume means the exit you're imagining may not exist at the price you're imagining it.
Chart check. Is it breaking out of a range on volume, or already up 150 percent and going vertical? Chasing the vertical part of a move is how scanners get blamed for losses the entry actually caused. More on picking which candidates deserve the trade: which penny stocks should you actually trade?
From scan to trade: where the risk math takes over
Here is where most penny traders actually lose, and it has nothing to do with scanning. A good candidate at the wrong size, or without a hard stop, converts a small edge into large losses. The mechanics that prevent that:
Size off risk, not conviction. Decide the dollars you're willing to lose on the trade, place the stop at the level that invalidates the setup, and let those two numbers dictate the share count. Our free position size calculator does the arithmetic: account size, risk percent, entry, stop, out comes the share count and R-multiple targets.
Bracket the entry. Stop and target attached at the moment of entry, as one order structure, so the exit exists before emotion gets a vote. How that works mechanically: bracket orders explained.
Fast, thin stocks punish improvised exits. That's not a reason to avoid the category; it's a reason the risk machinery has to be decided in advance, and ideally enforced by something other than willpower.
How XeanVI approaches penny scanning
XeanVI folds the workflow above into one automated pipeline: scheduled scans across the trading session surface candidates, each candidate is validated gate by gate against playbook rules (including catalyst checks), positions are sized off your configured risk limit, and every entry routes to your own Alpaca account as a bracket order with a hard loss cap attached. Every decision, including every skipped candidate, is logged so you can audit why. It's scanning, validation, and capped execution as one system rather than three tabs and a hope. Scope is deliberately narrow: US-listed stocks through Alpaca, rule-gated, paper mode first. See how the workflow fits together, or start with a beginner playbook before automating anything.
FAQ
What's the best free penny stock scanner?
Finviz and similar free screeners are legitimately useful for after-hours study and building familiarity with the filter profile above. Their limits are delayed data and weak float filtering, which is why they work for research and struggle for live momentum entries. Start free, learn the profile, and upgrade only when delay is the thing actually costing you.
What filters should a beginner start with?
The five in this guide: $1 to $5 price, float under 20 million, relative volume above 3x, gap over 10 percent, and enough dollar volume that the spread is tight. Fewer, stricter filters beat many loose ones, because the goal is a short list you can actually evaluate.
Should the scanner include OTC stocks?
For most beginners, no. Exchange-listed penny stocks (NYSE, Nasdaq) have listing standards, better data, and tighter spreads than OTC pink sheets, where promotion-driven pricing is far more common. Walk before running.
Do penny stock scanners work for finding shorts?
The same filters that find long momentum find overextended candidates, but shorting penny stocks adds locate availability, borrow fees, and unbounded loss potential. It's an advanced discipline with its own risk rules, not a filter toggle.
Key takeaways
- The best penny stock scanner setup is five filters: $1 to $5 price band, sub-20M float, 3x+ relative volume, 10%+ gap, and real dollar liquidity.
- Scan timing matters as much as filters: premarket and the first hour produce the setups, midday mostly produces noise.
- Every scan hit gets a catalyst, spread, and chart check before it becomes a trade.
- Losses come from sizing and exits, not scanning. Fix those with risk-based position sizing and bracketed entries decided in advance.
- Free delayed scanners are for studying; live momentum needs live data and, ideally, enforcement that doesn't depend on willpower.